

Like other digital products, after purchasing an SSD, many people will conduct a performance test on it, which will use a number of tools, but no matter whether it is a professional test or a white user, they will use a test software, which is CrystalDiskMark (hereinafter referred to as CDM).
Most of us generally use the results of CDM (mainly sequential read and write speeds) to verify that the business has not been false to the performance of the product, but do you know how it works? Today we will talk about it.
What is CDM (CrystalDiskMark)?
CDM, short for CrystalDiskMark, made its debut on the Windows platform in 2008 as storage benchmarking software. It assesses the speed of a hard disk under specified testing conditions. On macOS, there’s a similar benchmarking tool called AmorphousDiskMark, which operates somewhat similarly. The core functionality of CDM involves transferring files to gauge the data transmission speed of the hard disk.
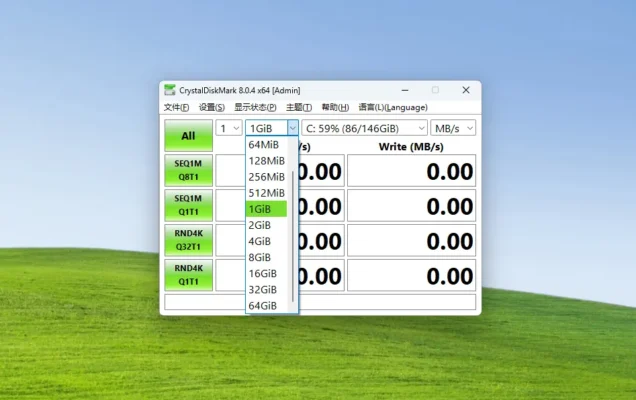
Before running the tests, you need to configure the working file size. This is the size of the file created by CDM for conducting read and write tests, ranging from 16MB to 64GB. Its default value is 1GB, which is a commonly used size for assessing the performance of accessing a significant amount of data on the hard disk.
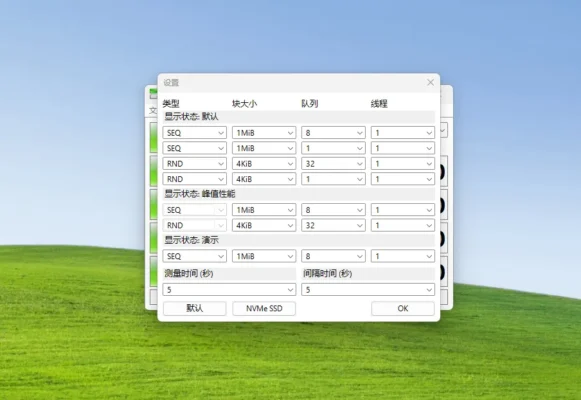
CDM comes with four preset benchmark tests, but by examining the advanced settings, you can customize the benchmarking parameters to obtain different results. CDM benchmark tests can be distilled into four crucial test parameters: sequential versus random operations, block size, queue depth, and threads.
Sequential (SEQ) and Random (RND) on CDM
CDM utilizes two primary types of benchmark tests: sequential and random, denoted as SEQ and RND, respectively. The key distinction between these two workloads lies in the organization of data. In a sequential workload, the data being accessed by the SSD is physically contiguous and can be accessed one after another in a sequential manner. On the other hand, a random workload involves either discontinuous or scattered data that may be distributed across the entire drive. Depending on various factors, the performance difference between sequential and random workloads can range from minimal to significant.

In general, SSDs excel at handling random workloads, whereas HDDs struggle with them. This is why you might observe HDD speeds drop below 10MB/s in random tests within CDM while exceeding 100MB/s in sequential tests. This discrepancy is due to the mechanical nature of HDDs, which involve the physical movement of components to read and write from the physical disk. Jumping from one location to another takes a considerable amount of time. Despite SSDs being non-mechanical, external factors still cause them to process random workloads slower than sequential workloads.
Block Size on CDM
Files are composed of blocks, which represent the maximum data size moved in a single input/output (I/O) operation. In the default tests provided by CDM, you will observe the use of different block sizes. Some tests employ a 1MiB block size, some use a 4KiB block size, and others use a 128KiB block size (approximately 128KB).
This might seem counterintuitive, but larger block sizes indeed result in faster transfer speeds, analogous to the difference between moving one piece of paper at a time versus moving an entire folder into a filing cabinet. Sequential file transfers typically involve larger blocks, while random workloads often use smaller blocks. Although CDM employs larger block sizes in sequential tests and smaller block sizes in random tests, the block size doesn’t necessarily indicate sequential or random behavior.
Queue Depth on CDM
Queue depth refers to the number of I/O requests being processed in a queue at any given time. The more open columns there are to transfer data, the greater the transfer speed. By default, CDM tests queue depths of 1, 8, and 32, but you can manually increase the queue depth and difficulty as needed. You can think of the queue as individual workers filing documents; evidently, more workers lead to faster filing.
Regardless of block size or the number of threads, higher queue depths generally lead to higher transfer speeds. However, higher queue depths can have a particularly significant impact on random workloads. To draw an analogy, two people submitting files one after the other into a filing cabinet will be much faster than one person doing it alone. Going from a queue depth of 1 to 32 can potentially result in a tenfold increase in transfer speed, which is substantial.
Threads on CDM
Threads differ in block size and queue depth, as they reside in the CPU rather than in storage. Each CPU has a certain number of cores, with each core usually having one or two threads, essentially being the CPU’s version of a queue. The more threads, the easier it is to handle multiple tasks at once. Threads are less significant in CDM, as out of the eight default tests, seven use only a single thread count, with only one test utilizing a thread count of 16.
However, tests that use a thread count of 16 clearly demonstrate that having a substantial number of CPU threads can be beneficial. Increasing from one thread to 16 threads in a random workload can result in approximately an 8-fold performance improvement. This is because the CPU also plays a crucial role in facilitating data transfers at a very fundamental level. However, the number of threads depends on the CPU, and not every processor has 16 threads. This might explain why CDM keeps the thread count at 1 in most of its default tests.
Interpreting CrystalDiskMark Results
CrystalDiskMark presents its findings in a structured format, showcasing performance metrics for each test category. The results typically include:
- Sequential Read/Write Speeds: Indicates how quickly data can be read from or written to the device sequentially.
- Random Read/Write Speeds: Reveals the device’s ability to handle small, random data transfers.
- 4K and 4KQD32 Read/Write Speeds: Highlights the device’s responsiveness during small data block operations.
Words in the end
It’s important to note that CrystalDiskMark provides a synthetic benchmark, meaning the results might not perfectly reflect real-world usage scenarios. The tool is helpful for comparing relative performance between different storage devices or configurations, but actual performance can vary based on factors like the specific hardware and software environment.
When using CrystalDiskMark or any other benchmarking tool, it’s recommended to consider a variety of benchmarks, real-world usage tests, and reviews to get a comprehensive understanding of a storage device’s performance characteristics.
Frequently Asked Question
Q1. Is CrystalDiskMark suitable for both HDDs and SSDs?
A1. Yes, CrystalDiskMark is versatile and can be used to benchmark both HDDs and SSDs effectively.
Q2. Can I rely solely on CrystalDiskMark results when purchasing a storage device?
A2. While CrystalDiskMark offers valuable insights, it’s recommended to consider real-world usage and other benchmarking tools for a comprehensive evaluation.
Q3. Does CrystalDiskMark support macOS?
A3. CrystalDiskMark primarily caters to Windows systems, but alternatives like “Blackmagic Disk Speed Test” are available for macOS.
Q4. Can CrystalDiskMark help diagnose hardware issues?
A4. CrystalDiskMark’s performance deviations could indicate potential hardware problems, prompting further investigation.
Q5. How frequently should I benchmark my storage device?
A5. Benchmark periodically, especially after system changes or updates, to monitor performance variations.
Q6. Are CrystalDiskMark results affected by the file system?
A6. Yes, the file system can impact results, particularly in scenarios involving small file transfers.

Related: